Biology Forum › Cell Biology › dna
- AuthorPosts
- June 28, 2006 at 6:55 pm #5137
 IsabellaParticipant
 - June 28, 2006 at 8:30 pm #50710
 LilKimParticipant
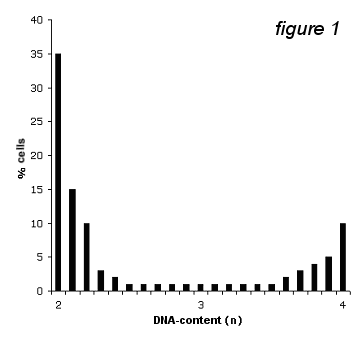
so i’m guessing that you’re looking at a population of many cells that have a DNA content that ranges from 2N (which is normal) to 4N (which can be .. normal or abnormal).
Anyways, i’m not sure if I completely understand your question… so, i’m not sure if i’ve given you a good hint. (do you have any more information?)
– kim
- June 29, 2006 at 7:07 am #50737
 GreenDogParticipant
I’d guess these cells are in G1. They have just finished mitosis because some of them still have 4n DNA. Most of them are just living their lives (G1) and have 2n DNA.
- June 29, 2006 at 9:51 am #50743
 herb386Participant
Actually it looks like a completely normal population of cells to me.
Cells with 2n DNA content will be in G1 and cells with 4n will be in G2 or M phase. All the cells with between 2n and 4n will be in S phase.
But I’ve probably missed something if your question says they are not healthy cells.
- June 29, 2006 at 10:24 am #50744
 IsabellaParticipant
right…this picture shows tumor-cells!
…and there should be 4 phases which I have to mark…but I dont know how to determine them!
Or maybe (just an idea!) one should ask: Why are the dna-contents that different? - June 29, 2006 at 1:42 pm #50745
 herb386Participant
The diagram on this site shows the amount of DNA present in each part of the cell cycle: 2n for G1, 4n for G2 and between 2n and 4n for S. I’m not sure about M phase and this site doesn’t really help with that but I don’t think you could really distinguish M and G2 phase with this type of diagram.
http://www.barrettsinfo.com/content/5_h … .htm#cycle
According to another site the difference between cancerous cells and normal ones in this type of diagram is the hight of the peak at 4n. In normal cells it should be below 6% (depending on cell type) but in cancerous cells it is higher. You also get more cells in S phase in a cancerous population.
I would just label the 4n peak with G2 and M phase.
- August 13, 2006 at 11:22 am #53283
 IsabellaParticipant
hi guys!
First of all: thanks herb! You were right!
The diagramm begins with g1-Phase (2n), then there is the s-phase (2n,3n,4n) and it all ends with the g2-phase!
Now I have antother question:
why are there (see picture) at the begining of the s-phase so many cell, and at the end of this phase the number is so reduced?
is the transition from g1 to s-phase so difficult? Or the transition from s-phase to g2-phase? During the 3n-dna-content-phase, there are only 1 or 2% percent in this phase? Why is that so? - August 13, 2006 at 9:25 pm #53320
 sdekivitParticipant
the cell cycle is an all-or-nothing process a cell can undergo. There are several ‘checkpoints’ during the cell cycle and when the demands for the checkpoint in the G1-phase has been fullfilled, the cell completely undergoes the S-phase. That’s why so less cells have a DNA-content of 3n. Onbly cells that are replicating DNA at the instant you examine the DNA-content can have this amount of DNA.
More about checkpoints during the cell cycle can be found in Molecular Biology of the Cell, by Alberts et al.
- August 14, 2006 at 9:21 am #53335
 IsabellaParticipant
thanks a lot sdekivit;-)
greets,
Isabella
- AuthorPosts
You must be logged in to reply to this topic.
