Biology Forum › Cell Biology › FACS results analysis
- AuthorPosts
- September 12, 2008 at 3:05 am #10077
 jasminaParticipant
i am a tyro in FACS analysis. so i am confused about some parameters.i use FACS machine to check the change of cell cycle phase.i want to ask some questions to better understand results.
1 FSC-H , I know the meaning of FSC , but I don’t know meaning of FSC-H
2 SSC-A, same problem with FSC-H
3 in this experiment ,I use PI to stain cells ,what’s the meaning of PI-W ,and PI-A
4 what’s the meaning of figures on coordinate axes
5 In oscillograph trace, if we adjusted frame at the begining of experiment , then we could not change it in the following process? Actually I thought 1st wave crest should be involved in the frame. So confused about it
6 in table, there are 2 percent, parent percent and total percent , what’s the difference between them? If we analysis results which percent is more reliable ?
7 if events are different, is there any comparability between different events results?
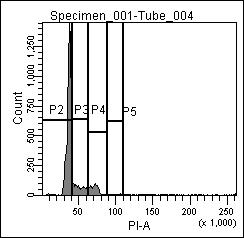
P2 sub-G1 phase
P3 G1/G0phase
P4 S phase
P5 G2/M phaseis there anyone who can help me? thank you a lot!
Attachments:

- September 12, 2008 at 6:11 am #85885biohazardParticipant
I’m in bit of a hurry, so I briefly try to explain some of your questions:
1, 2, 3: H is for height, the "peak" of the signal depending on its voltage. W is for width, essentially this depends on the duration of the signal. A is for area, which is basically H+W. I think there are some nice graphs that explain this if you google with keywords such as FSC, SSC and width, height & area.
4: The figures are called "relative intensity" or so, it just allows you to compare the magnitude of the signal, it’s not any special unit as such.
5: I believe you mean you adjusted the voltage and compensations beforehand? The gates ("frames?") themselves can be manipulated later.
6: Total % means all events the machine has analysed, then P1 means events that fall within your first gate. The events from P1 gate are then divided into four poplations, P2 to P5, which allows you to see cells in different stages of the cycle (like you point out in question 7 :))
7: The comparatibility of your results depends on the settings of your experiment and any other experiments you wish to compare. For many parts they are usually comparable, but on some they aren’t. I’ll try to explain this later, have to go now!
So, I wrote this in bit of a hurry, so I may have missed something, misunderstood or made a mistake there, so keep that in mind 😉
- September 12, 2008 at 11:08 am #85889jasminaParticipant
thank you very much!
BUT i still confused about the middle figure, in this figure , do G0/G1 phase always around 50?and G2/M phase aound 100? can’t we adjust the figure to make peak involved in G1/G0 phase? - September 12, 2008 at 12:31 pm #85892biohazardParticipant
G0/G1 do not always hit around 50 – the value can be pretty much anything depending on your experiment’s settings, e.g. the voltage and intensity & type of your fluorochrome. This is why it is "relative intensity" on the x-axis of your histogram (while y-axis simply counts the number of events having the given intensity).
Often the intensity values vary so much that they don’t fit on the "normal" range displayed on the graph (0-250*10^3), in which case people tend to switch on a logarithmic scale.
If you standardise your experiment well on all aspects, the values between different runs can still be reasonably well compared against one another. But if e.g. another lab makes the same experiment, the values are likely to be different due to minor chances in experiment conditions, reagents, machinery etc.
- September 15, 2008 at 3:15 am #85935jasminaParticipant
thousands thanks!
- AuthorPosts


You must be logged in to reply to this topic.